

HTB - Introduction To Splunk & SPL
僅撰寫文章最後題目解題過程。
1-1
Q1. Navigate to http://[Target IP]:8000, open the “Search & Reporting” application, and find through an SPL search against all data the account name with the highest amount of Kerberos authentication ticket requests. Enter it as your answer.
Q1. 找出 Kerberos ticket requests 最多的帳號
關於Kerberos ticket,可以看這篇
前往splunk,我們在搜尋欄位中尋找event id=47694769 是 A Kerberos service ticket was requested,也就是 Kerberos 驗證票證請求事件。
1 | |
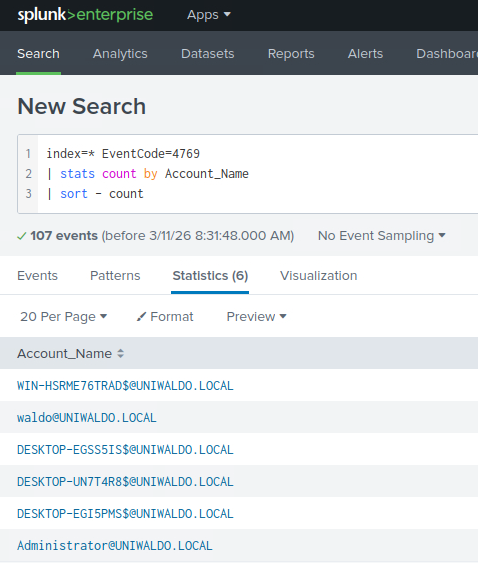
可以看到排在第一的WIN-HSRME76TRAD$@UNIWALDO.LOCAL是電腦帳號,不是一般使用者帳號($符號)
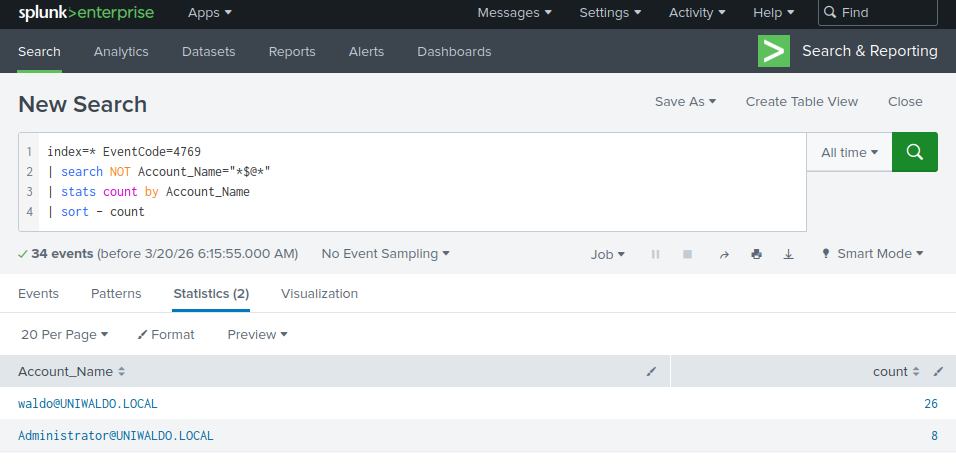
因此我們可以進行簡單的過濾,加上NOT:
1 | |
過濾完剩下的第一個就是請求Kerberos ticket最多次的帳號
Q2 Navigate to http://[Target IP]:8000, open the “Search & Reporting” application, and find through an SPL search against all 4624 events the count of distinct computers accessed by the account name SYSTEM. Enter it as your answer.
Q2 查詢所有 4624 事件中由帳戶名稱 SYSTEM 存取的不同電腦的數量。
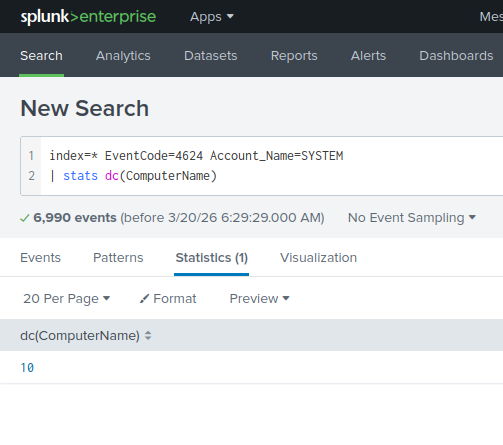
4264是成功登入事件,由於SYSTEM是Windows內建高權限帳號,因此系統服務、背景程序、排程、系統元件都會用它執行。
1 | |
dc(...) = distinct count,不重複計數as ans 是將結果欄位命名為ans,依自己喜好取即可,若沒有自定義的話欄位名稱會叫dc(ComputerName)。
Q3 Navigate to http://[Target IP]:8000, open the “Search & Reporting” application, and run a SPL search against all 4624 events. Identify the accounts whose total login activity occurred within a time range of less than 10 minutes. As your answer, enter the name of the account having highest login attempts.
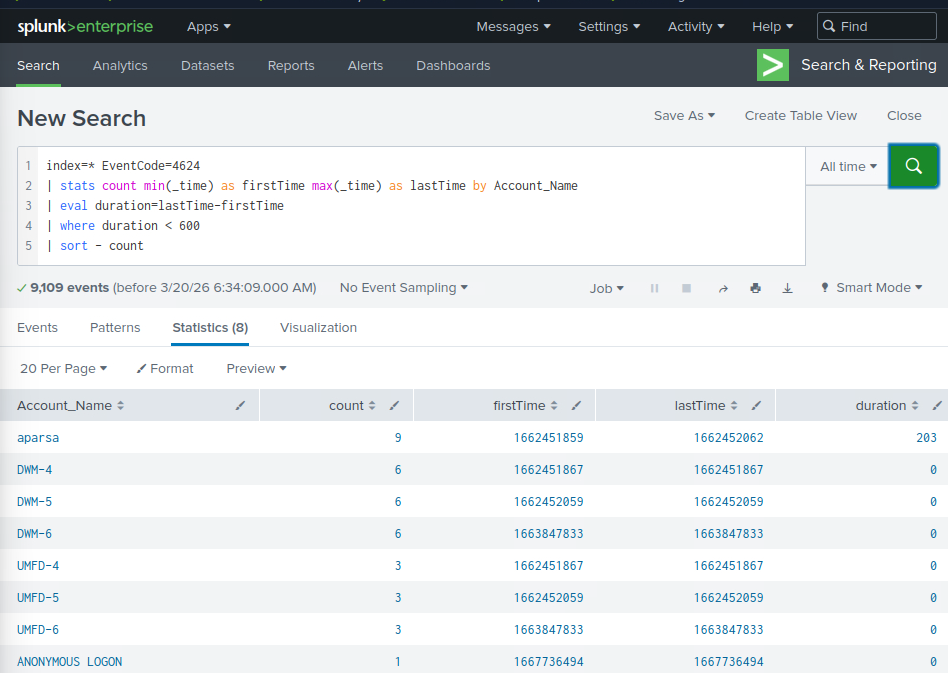
Q3 查詢所有4624事件,算每個帳號的最早登入時間和最晚登入時間都在十分鐘內且嘗試登入最多次的帳號名稱。
1 | |
min(_time):最早登入時間
max(_time):最晚登入時間
duration:整體活動跨度,單位是秒
where duration < 600:只保留 少於 10 分鐘 的帳號
1-2
Q1 Access the Sysmon App for Splunk and go to the “Reports” tab. Fix the search associated with the “Net - net view” report and provide the complete executed command as your answer. Answer format: net view /Domain:_.local
Q2 Access the Sysmon App for Splunk, go to the “Network Activity” tab, and choose “Network Connections”. Fix the search and provide the number of connections that SharpHound.exe has initiated as your answer.
懶得寫這邊答案直接google吧
2-1
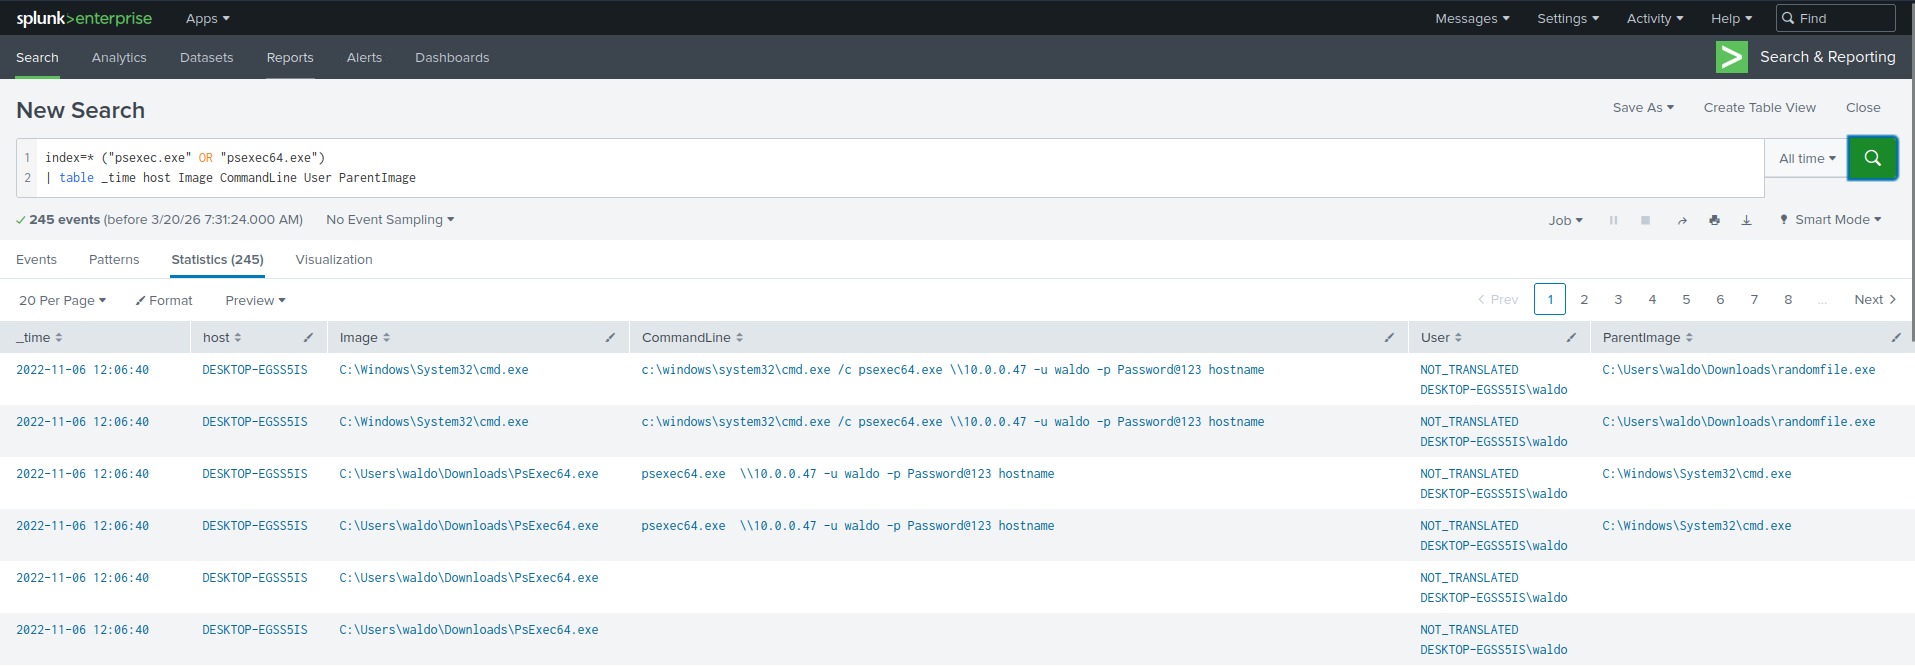
Q1 Navigate to http://[Target IP]:8000, open the “Search & Reporting” application, and find through SPL searches against all data the password utilized during the PsExec activity. Enter it as your answer.
Q1 搜尋 PsExec 活動期間使用的密碼
1 | |
2-2
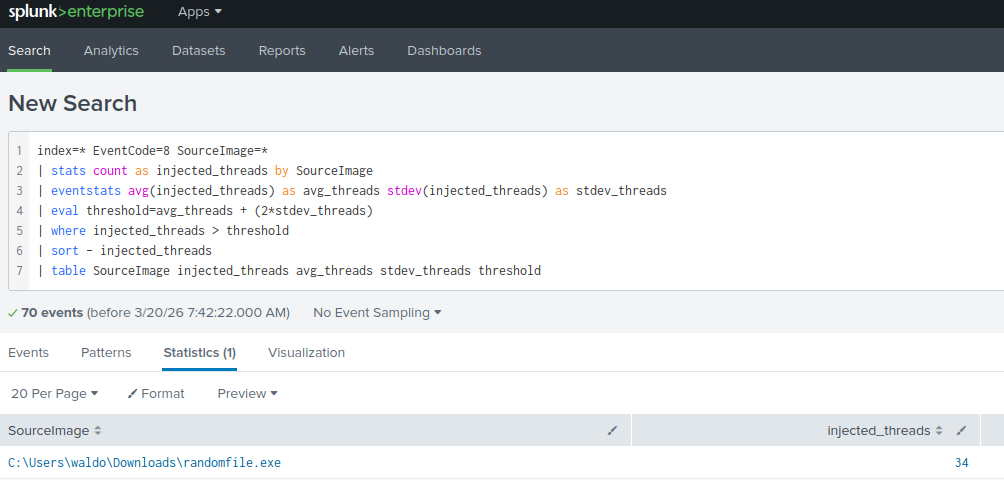
Q1 Navigate to http://[Target IP]:8000, open the “Search & Reporting” application, and find through an analytics-driven SPL search against all data the source process images that are creating an unusually high number of threads in other processes. Enter the outlier process name as your answer where the number of injected threads is greater than two standard deviations above the average. Answer format: _.exe
Q1 找處哪個exe檔建立process的數量異常的高。
先統計每個 SourceImage 建了多少次遠端執行緒,再用整體平均值和標準差找出明顯高於正常水準的異常程式。
1 | |
3-1
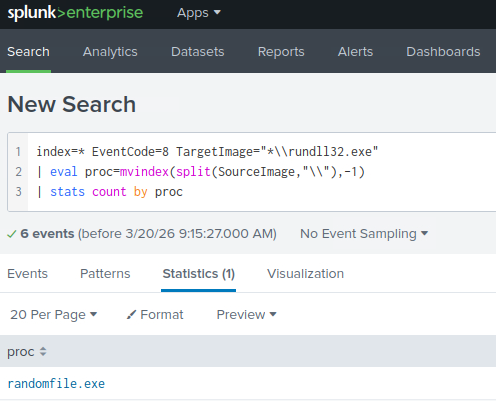
Q1 Navigate to http://[Target IP]:8000, open the “Search & Reporting” application, and find through SPL searches against all data the process that created remote threads in rundll32.exe. Answer format: _.exe
Q1 找出哪一個程式曾經在 rundll32.exe 中建立遠端執行緒
有關建立遠端執行緒
1 | |
Q2 Navigate to http://[Target IP]:8000, open the “Search & Reporting” application, and find through SPL searches against all data the process that started the infection. Answer format: _.exe
Q2 找出惡意程式真正開始運作的那個process
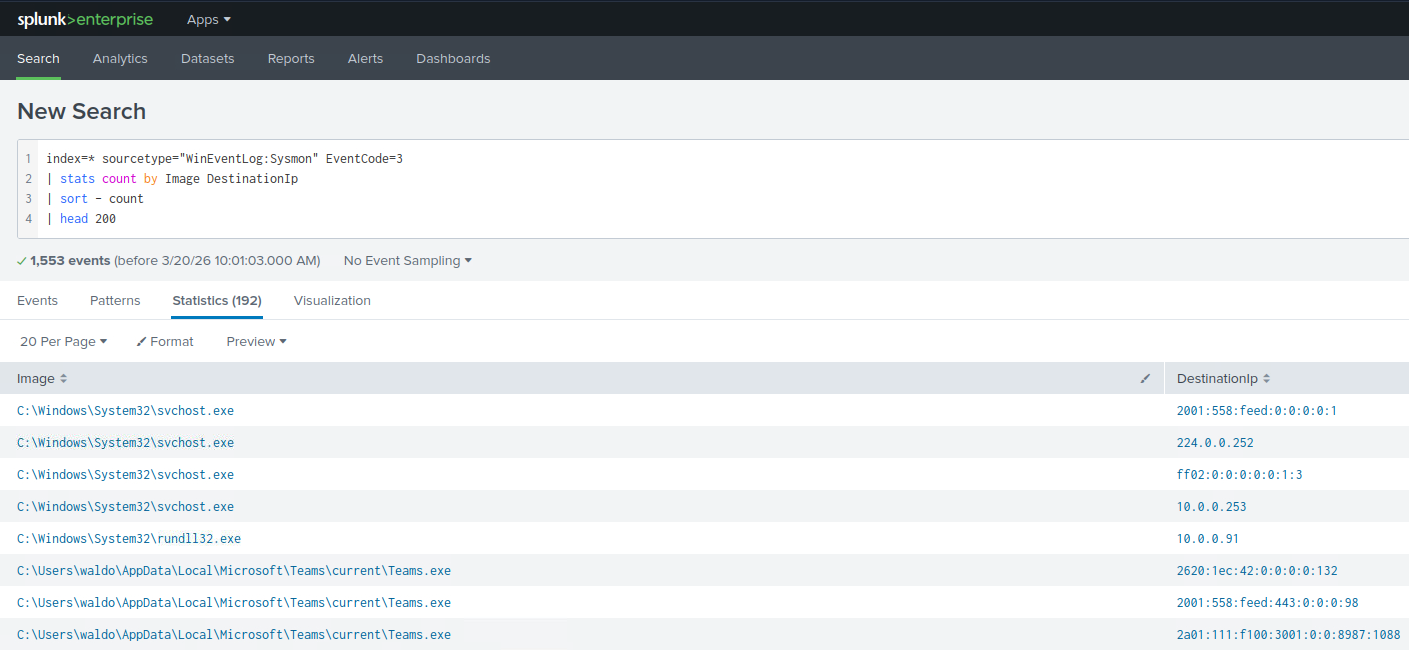
首先縮圈,找出最常被連到的目的地(快速辨識 C2)
1 | |
會看到10.0.0.91
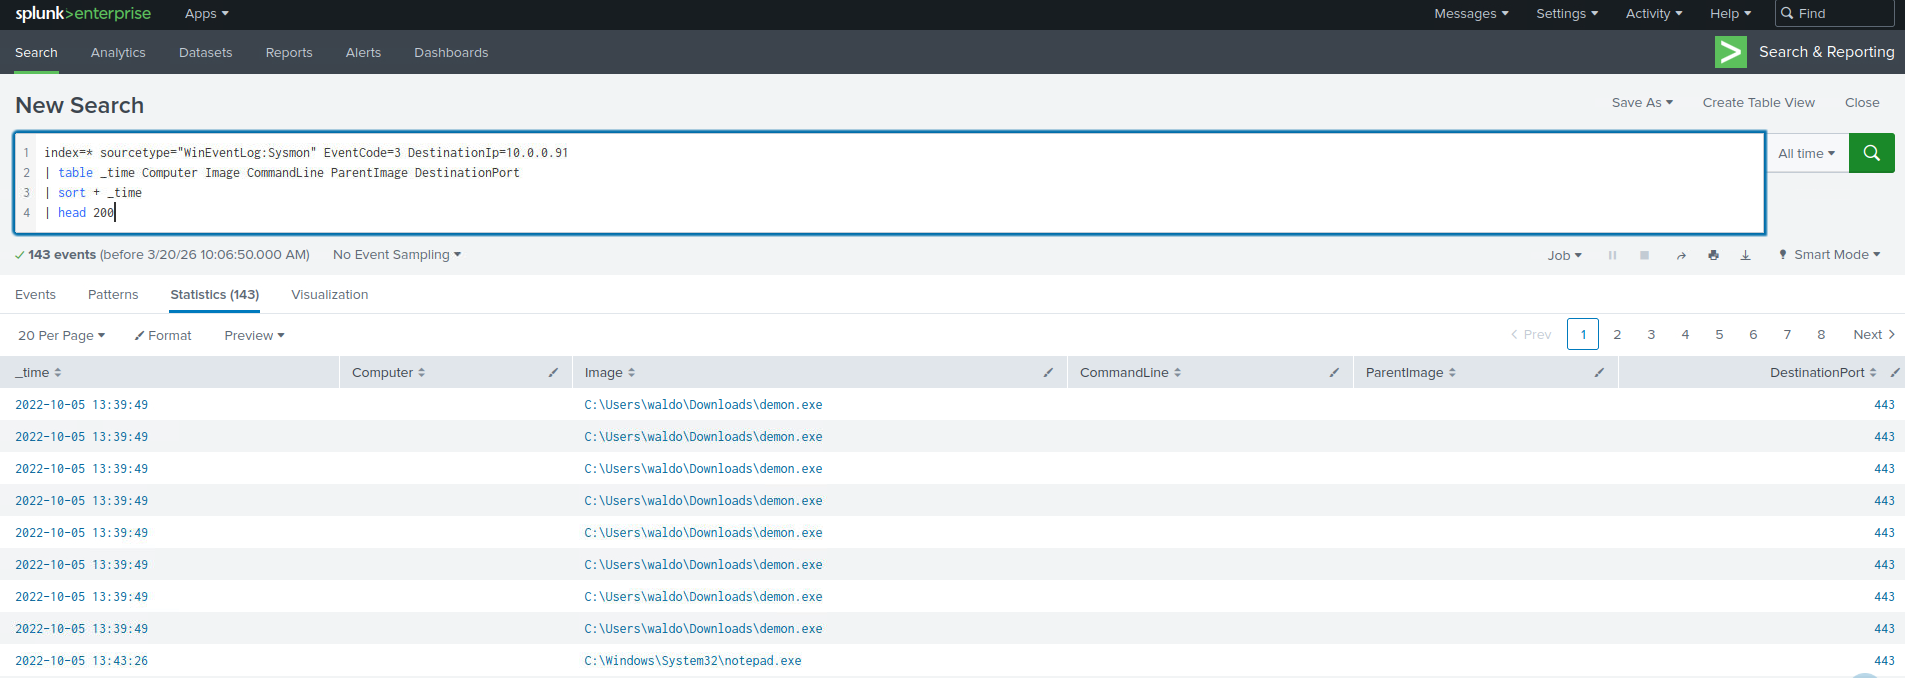
接著我們查看不常見的 process 在做外連
1 | |
查詢連線程式
1 | |
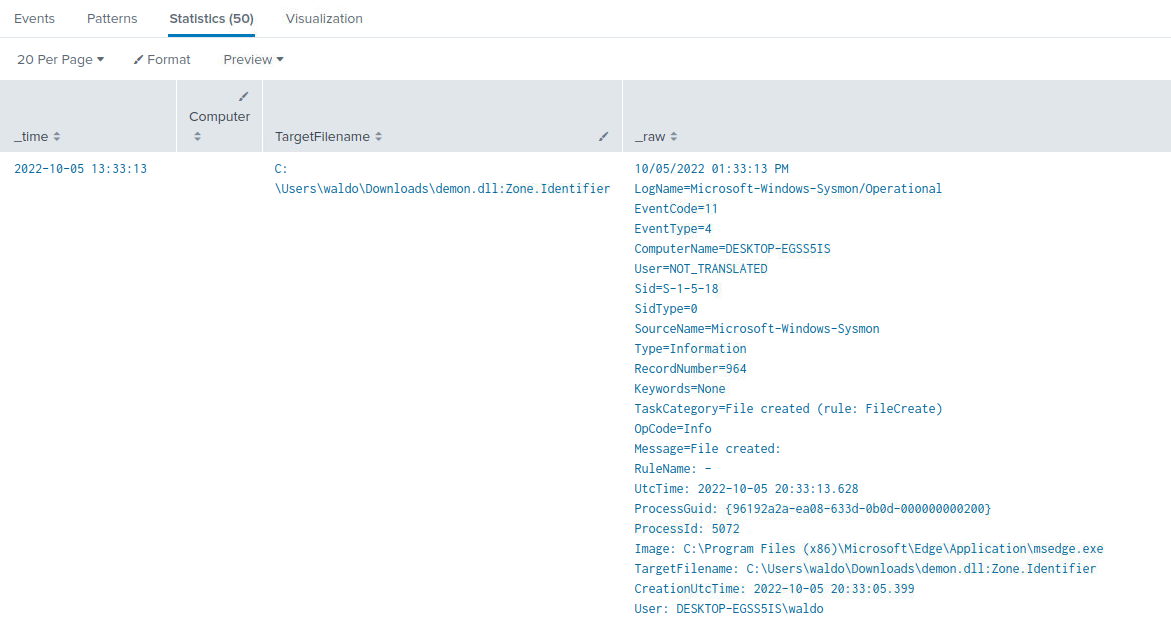
證據
1 | |
1 | |
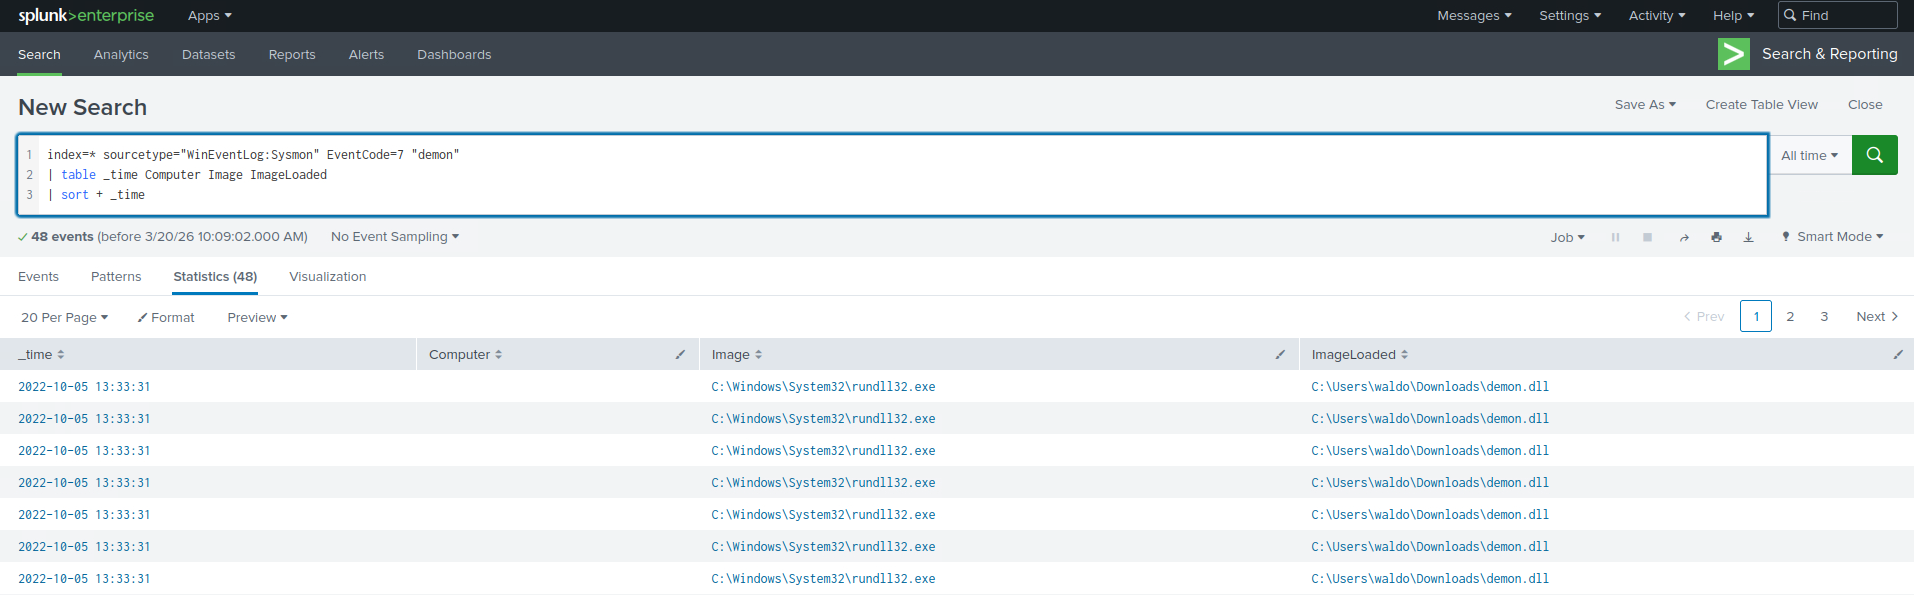
2022-10-05 13:33:31,主機 HOST-A 的 Sysmon ProcessCreate (EventCode=1) 顯示 Image=C:\Windows\System32\rundll32.exe,CommandLine=”rundll32.exe demon.dll,havoc”,ParentImage=C:\Windows\System32\cmd.exe(ParentCommandLine:”C:\Windows\system32\cmd.exe”)。
於此之前,於download_time 發現 Zone.Identifier 記錄 C:\Users\waldo\Downloads\demon.exe:Zone.Identifier(表示檔案來自網路下載)。隨後(或接近時間)該主機在 _time 產生對 10.0.0.91 的 network connection(EventCode=3, DestinationPort=443),綜合可判斷 demon 為下載後執行之 payload,並由 rundll32.exe 載入/執行後與 C2 通訊。